An NQ chart review from Moh’s beginner course
Follow a timestamped NQ replay from Moh’s course: higher-timeframe context, entry alternatives, invalidation, targets and trade-review notes.
The chart being reviewed
For the contract and order basics behind this example, read the day trading futures guide first.
This walkthrough follows the NQ example beginning at 2:50:27 in Moh’s beginner course. Moh returns to an earlier part of the chart and demonstrates several possible entries. It is a retrospective teaching example; the recording does not establish an executed order, a fill price or a realized return for this setup.
The chart below is taken from that recording at 2:51:38. Its labels identify Nasdaq-100 E-mini futures on a one-minute chart, with a chart date of September 19, 2025. The shaded areas and trade-planning tool are Moh’s original annotations.
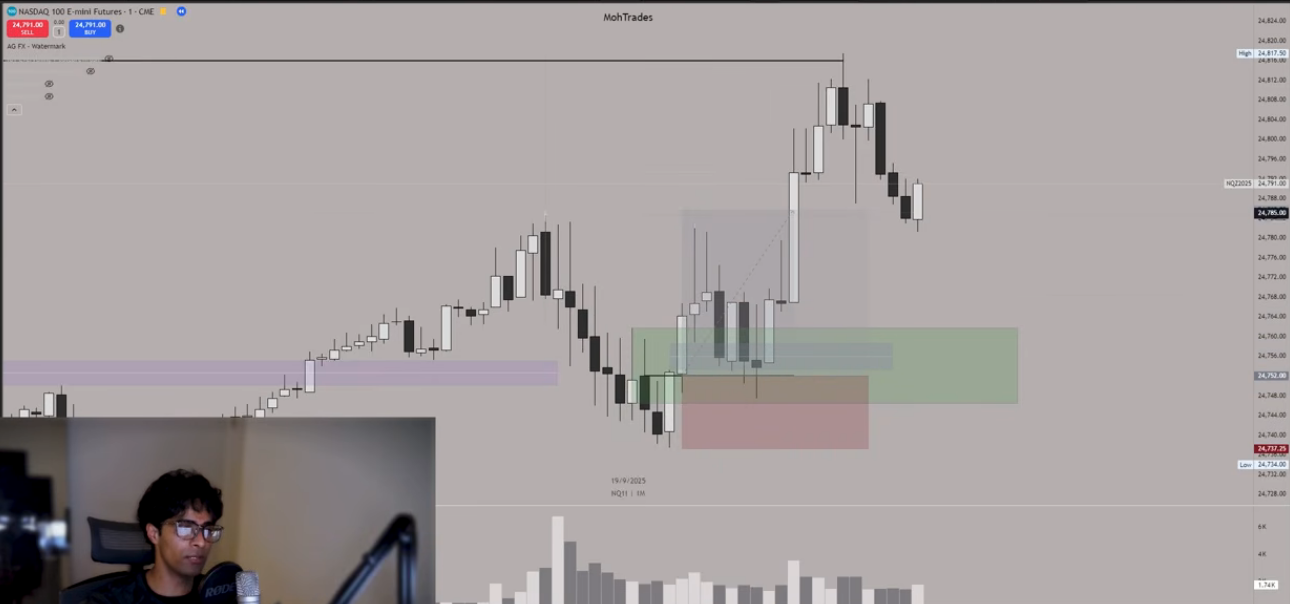
The useful review question is whether the setup, invalidation and management rules can be written down before seeing the later candles. A chart that eventually moves higher gives us an example to examine, not a measured win rate.
Start with the higher-timeframe context
At 2:50:27–2:51:00, Moh identifies a 15-minute bullish fair value gap and previous-day high as the upside objective. He then examines the lower-timeframe movement after price trades into that area.
In his explanation, the higher-timeframe zone supplies the location to investigate. The entry still needs a lower-timeframe trigger. Earlier in the chapter, he pairs a 15-minute zone with a one-minute confirmation chart. Timeframe alignment at 2:41:49.
For a review note, record both the zone and the intended objective. Writing only “bullish fair value gap” leaves out which move the setup is meant to capture. Also record what information was visible at the proposed decision time; this screenshot already includes the later rally.
Separate the entry alternatives
At 2:51:06, Moh identifies several lower-timeframe features in the same move. He discusses a change in state of delivery and its associated order block, a fair value gap, and a breaker.
| Feature in the explanation | What the review needs to specify |
|---|---|
| Change in state of delivery / order block | The confirming close and whether the entry requires a later return to the marked area |
| Fair value gap | The exact zone and the price or event that would count as an entry |
| Breaker | The confirming break and the condition for entering from that structure |
These are alternative ways to define an entry around the same historical movement. A backtest needs a rule for selecting between them. Counting whichever entry looks best afterward would change the strategy from example to example.
The recording also illustrates this issue in its preceding example: Moh notes that a proposed return to an order block does not occur, then examines a later breaker entry. Treat those as distinct entry rules when recording results. A missed limit entry remains a missed entry under the original rule. Preceding example at 2:49:19.
Define invalidation before comparing targets
For the NQ order-block example, Moh places the proposed stop beneath the internal low. He then compares the internal high with previous-day high as possible objectives. Stop and target discussion at 2:51:30.
In the screenshot, the red portion of the planning tool sits below the proposed entry. The earlier local peak and the horizontal high near the top provide separate reference points above it.
Moh changes the entry tool while discussing the alternatives, so the recording contains several projected reward-to-risk figures. They describe different drawings. They are not several realized returns from one order.
Keep the entry, stop and target together in each journal record. Changing one changes the planned risk or reward. If you want to compare an internal-high target with a previous-day-high target, retain both versions as separate test cases and apply each consistently across the sample.
The NQ and MNQ sizing guide explains how a point distance translates into dollar exposure. The same-looking chart does not give the two contracts the same dollar risk.
Record the management rule and its trigger
At 2:52:09, Moh describes moving the stop to the entry level when price takes the internal high created before the pullback. If that high is reached before the setup triggers, he stops looking for that sequence’s entry.
At 2:53:05–2:54:22, he also examines the corresponding internal highs on NQ and ES. His example uses one index reaching that reference level as a reason to manage a position in the other.
Those conditions need their own journal fields. Record the triggering market, level and time, followed by the stop change or decision to pass. A note saying “moved to breakeven” omits why it happened and whether the same rule was used on other trades.
Moving a stop to the entry price does not establish a zero-cost outcome. Fees and execution differences still belong in the recorded result. For a prop account, compare the entire position’s equity path with its limits as well; an attractive closing result does not undo an earlier breach. See end-of-day drawdown.
Turn this example into a review you can repeat
Use a chart-replay tool with future candles hidden to practise recording decisions as new bars appear. Recreating this example is a practice exercise: the source video already shows the rally. For an unseen test, choose dates you have not reviewed.
Start the chart replay before the proposed confirmation and record the higher-timeframe zone, the objective and one entry rule. Advance until that rule either triggers or becomes invalid. Save a second screenshot at that moment, before revealing the outcome.
Then record the proposed stop, target and management conditions. Keep a decision to pass in the sample. It tells you whether you followed the rule, even though it produces no trade.
Finally, compare the planned sequence with what the replay actually shows. Separate a valid setup that loses from a trade that never met the entry conditions. Include costs and state any assumption about a fill that the chart cannot verify.
This example supplies a concrete sequence to study. Assessing the method requires a broader sample with fixed rules and unseen data. The prop-rule backtesting guide provides a framework for doing that without treating one selected chart as a performance record.
Keep the conversation going.
Bring your questions to Discord, or follow my market sessions on YouTube.