An NQ inverse fair value gap trade, from entry to exit
Follow Moh’s NQ short through the chart review and recorded trade: ES divergence, the confirming close, a 13-point stop and a nearby target.
The decision behind the trade
New to futures? The beginner’s guide explains the contracts, order types and risk calculation used to study a trade like this one.
In his October 18, 2024 video, Moh reviews an NQ short from October 16, then includes a recording of the entry and management. The setup combines a higher-timeframe bearish zone, a divergence between NQ and ES, and a lower-timeframe confirmation.
The useful detail is his target. He chooses a nearby opposing fair value gap rather than assuming the market will keep falling to the day’s low. That decision defines how much of the move he is trying to capture.
The opening breakdown is retrospective. The recorded trade begins at 8:27. Moh reports a profitable result, but this article does not independently verify his fills, account balances or net return. It examines the decisions visible and described in the recording.
Compare NQ with ES before looking for an entry
At 1:39–2:52, Moh follows the two markets through different reference levels. NQ first takes the previous day’s low while ES does not. Later, ES takes its high of day while NQ remains inside a bearish 15-minute fair value gap.
He interprets that later divergence as relative weakness in NQ and begins looking for a short there. In his terminology, an SMT divergence means the two related markets do not both reach their corresponding high or low. It supplies context for this example; it does not establish that every divergence will reverse price.
Notice that his interpretation changes as the sequence develops. The first divergence does not commit him to buying for the rest of the session. The daily-bias guide explains how he links a directional view to an objective and the market’s response.
Mark the opposing zone before the trigger
At 2:52–3:24, Moh identifies a bullish 15-minute fair value gap below price. This becomes his short’s intended target. He expects that area could interrupt the decline and leave price ranging between the opposing higher-timeframe gaps.
A fair value gap, as used in these videos, is a three-candle price formation with a gap between the first and third candle’s wicks. The name describes a chart concept; it does not mean the area must fill or that it reveals every order waiting there.
For this review, record the target before examining the entry. Moving it farther away after seeing later candles would change the original decision.
Wait for the close that changes the setup
On the one-minute chart, Moh first looks for a change in state of delivery: a close beyond the candle level he uses to identify a shift in direction. He then watches price respect the resulting bearish order block while a bullish fair value gap still sits beneath it. Explanation at 3:49–5:20.
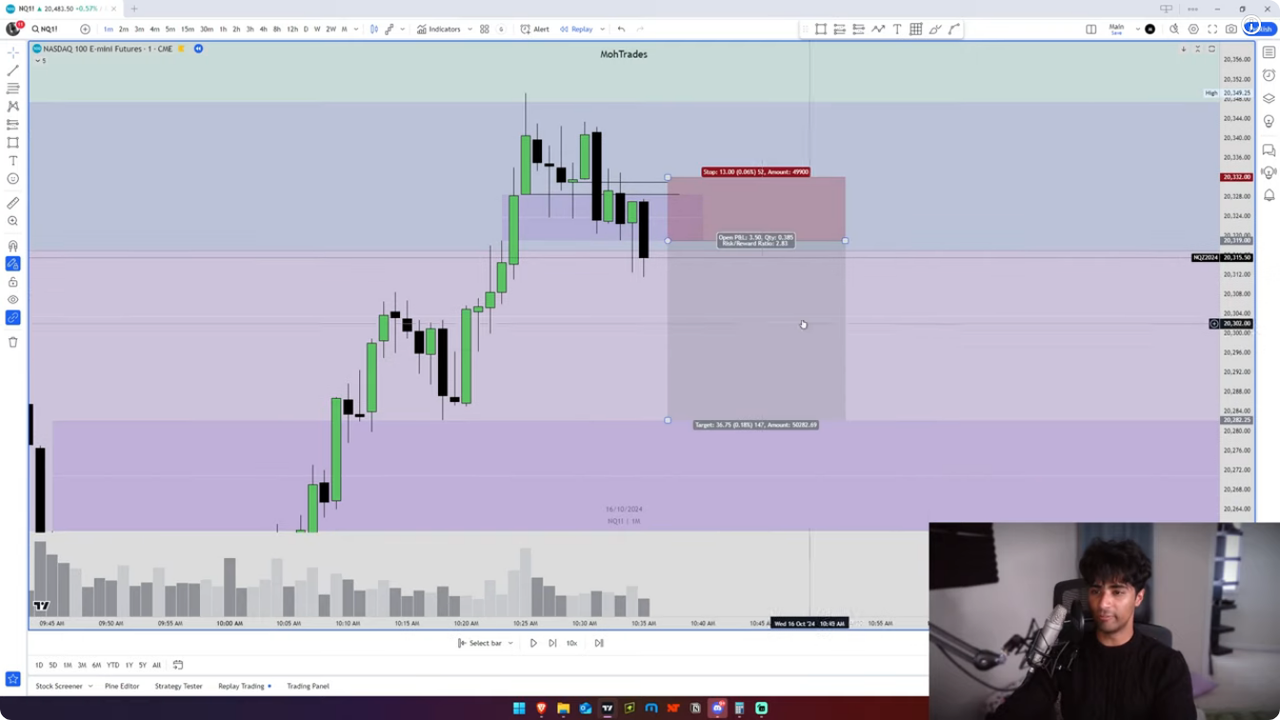
The remaining condition is a close below that bullish gap. At 5:29–6:08, he identifies that close at 10:35 on the chart, then describes placing an order at the gap and entering on the next minute’s return. A bullish gap that has been broken and is then used as a bearish reference is the inverse fair value gap in this example.
His proposed stop is 13 NQ points, with the opposing 15-minute gap as the target. The point distance describes the setup. Dollar exposure also depends on the contract and quantity, as the NQ/MNQ sizing guide explains.
Compare the explanation with the recording
The recorded segment begins with order messages and Moh identifying the inverse-gap short. He discusses the stop distance, then settles on 13 points and names the 15-minute gap as the target. Recorded entry at 8:27–9:09.
In the earlier breakdown, he says he moved the stop to entry when price traded beneath the internal low. In the recorded segment, he announces the stop change at 9:26. Later, at 10:48–11:23, he describes moving it farther in his favor before the trade concludes.
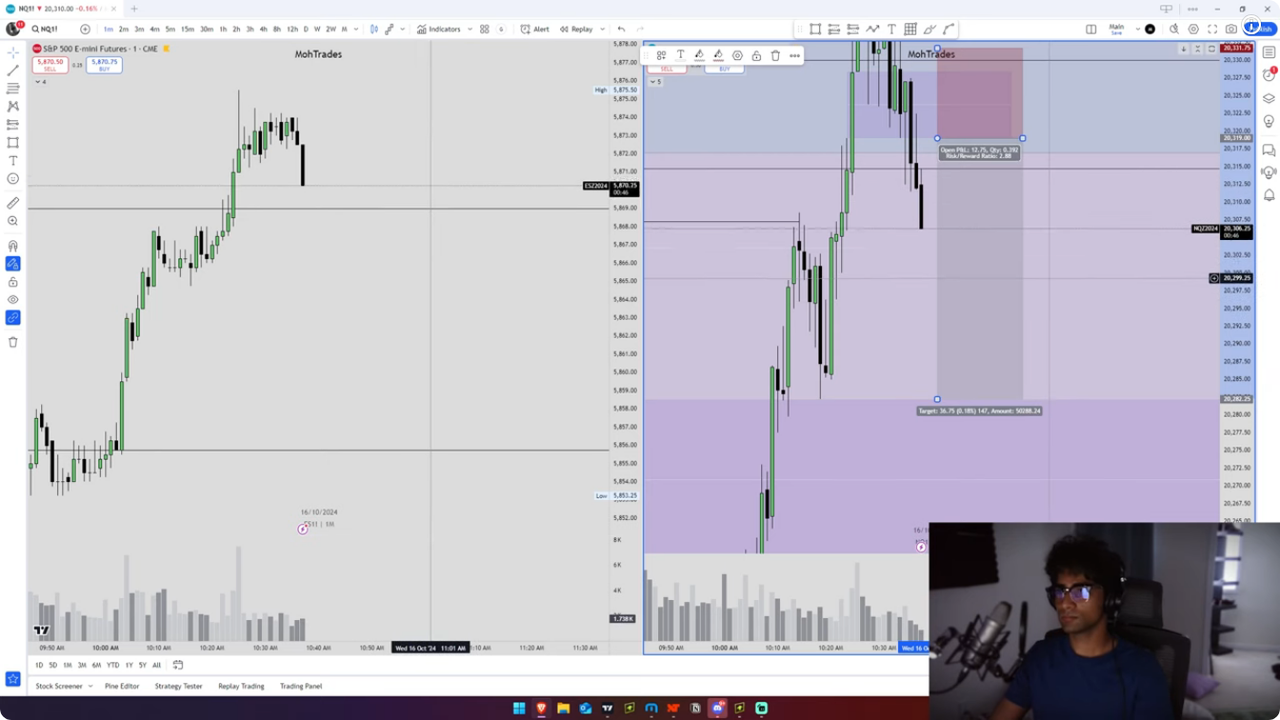
These are separate management decisions. A journal entry saying only “breakeven stop” would omit the later adjustment. A stop at entry also does not guarantee a zero-cost result after fees and execution differences.
Afterward, Moh returns to why he chose the nearer target: he expected possible congestion between the two higher-timeframe gaps. Post-trade explanation at 11:38–12:08.
What to record when studying this setup
Keep the source’s chart review and recorded trade separate in your notes. For each, record:
- The NQ zone and the corresponding ES high or low used for context.
- The opposing gap chosen as the objective before entry.
- The confirming candle close, order location and initial stop.
- Each management trigger, when it occurred and how the stop changed.
- Whether the evidence comes from a replay, a spoken explanation or the recorded order sequence.
This is a selected winning example. It does not measure how often the setup loses, misses an entry or produces a worse fill. Study the conditions for passing alongside it, then test a fixed rule set on unseen dates. The course replay review shows how to keep alternative entries and hindsight out of the same result.
Keep the conversation going.
Bring your questions to Discord, or follow my market sessions on YouTube.